Making Sense of your Research data for Valuable Insights
Making Data-Driven Decisions in Higher Education
The importance of research data in Higher Education (HE) cannot be understated. From enhancing learning methods to driving critical administrative decisions, research data holds the key to invaluable insights that can drive decisions and keep stakeholders moving towards the same goals.
Yet, many organisations often struggle to manage and make sense of this valuable asset. The challenges of siloed operations, scattered data sources, and readability of the data itself are all too common. But have no fear. We from 6bythree are here to guide you through these choppy waters!
Today, we shine a light on the importance of unifying, understanding, and utilising your research data effectively to empower your stakeholders with intelligently actionable information.
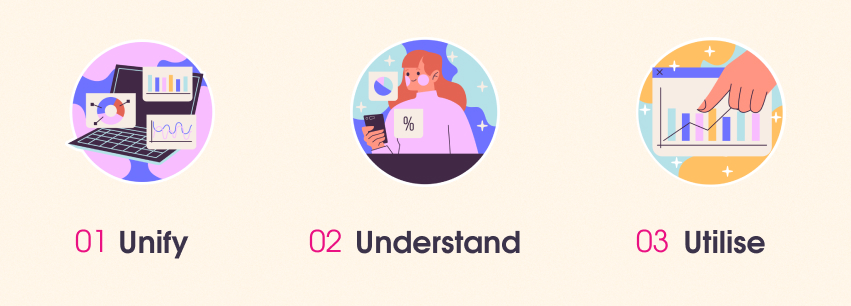
1. Unify

Breaking Down the Silos
A common hurdle organisations face comes from the fragmentation of insights collected from diverse sources. The result? Isolated silos of data that resist integration.
Bringing your data together with tools like Tableau and Microsoft Power BI, which are designed for easy data integration, can provide valuable organisational insights.
Speaking to stakeholders and understanding different goals and alignment across the organisation is key to having a good data set. However, these insights can often become fragmented and duplicated between departments. Shared research repositories and customer insight tools such as Dovetail can help bridge this gap by allowing you one single place to find research and insights across the organisation. This can help bring shared alignment and clear, actionable results to any project.
Unifying Data and Breaking Barriers
Working towards the creation of a single source of truth is the end goal. Data integration tools can assist in this endeavour. Tools like Talend and Informatica facilitate comprehensive data integration, allowing for more centrally managed and easily interpreted data.
Using these platforms to build a unified data ecosystem transforms your research data into a dynamic asset. This seamless interaction allows for collaboration among staff members, creating an alignment of goals and objectives across departments.
2. Understand

Making sense of the data
Making sense out of mountains of data is another challenge. Thankfully, tools like Google Data Studio and Tableau can help transform complex data into easy-to-understand visuals. This gives key decision-makers a more intuitive perspective for data-driven decisions.
Improving Website User Experience
Website dynamics play a pivotal role in user engagement. Particular attention should be given to Call-To-Actions and user journeys. Useful free tools like Hotjar and Google Analytics can provide invaluable insights into user behaviour, helping to refine and optimise user experience. We always start our projects with a benchmark and audit of your digital estate to allow for key goals and KPIs to be defined early on.
Understanding your Audience
Getting to grips with your users – their behaviours, motivations and actions – is central to creating products and services that best meet their needs. Qualitative data tools like Qualaroo can provide deep insights into user motivations, informing future decisions. A key part of this should also be conducting user research sessions 1:1 with your audience. Recruiting these through your own channels using a Google Form survey on your social media or via surveys using Hotjar on your website can lead to invaluable qualitative data to help inform the way forward.
3. Utilise
Leveraging Data for Strategic Advantage
Once your data is unified and understood, the next step is to utilise it effectively. Dashboards and visualisations can transform raw data into clear insights. Utilising tools like Looker and Domo can make data accessible and comprehensive, aiding informed decision-making in real time.
Utilising AI and Machine Learning
Crisp, clear, and unified data is the foundation for insightful understanding. Technologies like Google Cloud’s AI and Microsoft Azure AI offer robust machine learning capabilities that can reveal deeper insights, patterns, and connections within your data, aiding in more informed decision-making processes.
Boosting Stakeholder Engagement
Engaging key stakeholders is vital in the successful implementation of data-driven initiatives. Sharing accessible data insights allows stakeholders to perceive the value and potential of the data at hand. Presentation tools like Prezi or infographics created with Canva can be powerful, visually appealing ways to communicate complex data.
The Path Forward: Integrated Data Systems
Understanding and efficiently utilising research data can significantly impact your organisation’s growth and success. Unification of data, understanding user behaviour, making data comprehensible, and striving towards the goal of a single source of data truth are solid steps towards this end. And remember, 6bythree are always here to lend a helping hand on this journey.